21. March 2025 By Emir İnanç
Building a Scalable Load Testing Framework for Enterprise AI Chatbots
In today’s digital landscape, AI-powered chatbots have become indispensable tools for enterprises to increase the effectiveness of business processes & operations. We have been testing an AI-powered Smart Assistant Chatbot designed exclusively for customer employees and hosted on an internal platform. As with any enterprise-level application, ensuring the bot performs reliably under various load conditions is crucial. In this article, I’ll share our journey of creating a comprehensive load-testing framework for the chatbot, detailing our architecture, methodology, and the lessons we learned along the way.
Challenges and Solutions
The architecture includes a backend that handles data regarding chatbot usage, which we could call the metadata layer, and a bot service that handles AI processing.
Scaling with Limited Resources
One of the most significant challenges was achieving high loads without access to dedicated load-testing infrastructure. Since we needed to test our chatbot with up to 100 virtual users to simulate realistic enterprise loads, we had to get creative with our approach. Without a Virtual Runner or cloud-based load-testing infrastructure, we implemented a distributed testing strategy:
- Distributed Test Execution: We ran our k6 tests concurrently across 5 personal computers, with each machine handling a portion of the total load.
- Report Aggregation: After test execution, the reports needed to collect and aggregate the results from all machines. For this end, we crafted custom aggregation scripts. This approach allowed us to overcome hardware limitations while still achieving our testing goals.
- Execution performance: The fact that k6 is written in Go — a language known for its efficiency and low resource consumption — made this distributed approach feasible even on standard development machines.
Token Management Across Distributed Tests
Another challenge specific to our distributed testing setup was managing authentication tokens. To address this, we enhanced our user management module to:
- Create & Partition Token Pool: Automatically divide available test users among different test instances.
- Prevent Conflicts: Ensure no two machines use the same user tokens.
- Track Usage: Monitor token usage across all test instances through logging.
Architecture
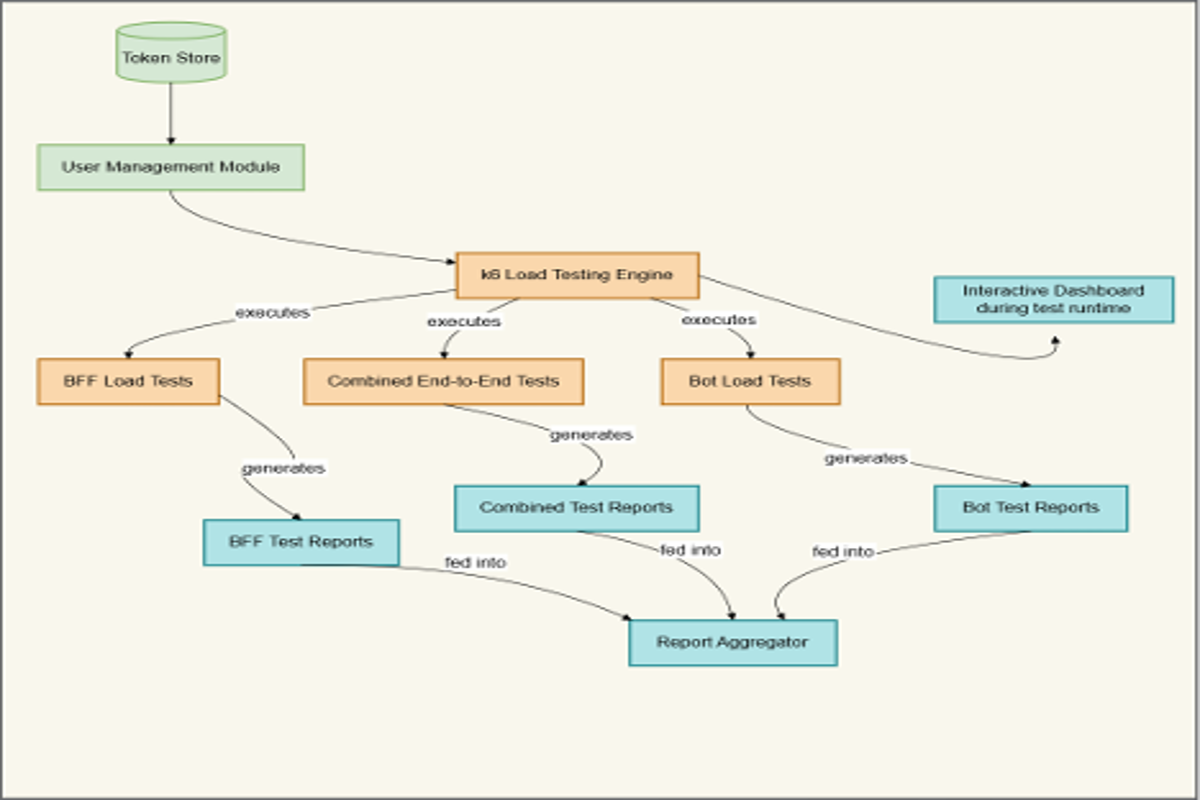
Our load-testing framework follows a modular, component-based architecture that allows for both isolated and integrated testing of different services.
Load Testing Architecture
The diagram is at right side illustrates the overall structure:

Token Store Diagram
User Management
One of the most critical components of our framework is the UserManagement class, which handles the allocation of user tokens during test execution:
	export class UserManagement {
	    constructor(){
	        this.activeUsers = new Set();
	        this.userLocks = {};
	        //Load test tokens with both bffToken and botToken
	        this.users = new SharedArray('users', function(){
	            const filePath = import.meta.resolve('../tokens/all_tokens.json');
	            const data = JSON.parse(open(filePath));
	            return Object.entries(data.tokens).map(([email, details]= => ({
	                email,
	                bffToken: details.bffToken,
	                botToken: details.botToken,
	                id: details.id
	            }));
	        });
	    }
	    getRandomUser()
	        const startTime = Date.now();
	        const availableUsers = this.users.filter(user => !this.activeUsers.has(user.email));
	        if(availableUsers.length === 0) {
	            console.error(`VU ${exec.vu.idInTest): No available users!`);
	            return {user: null, selectionTime: Date.now() -startTime};
	        }
	        const selectedUser = availableUsers[Math.floor(Math.random() * availableUsers.length)];
	        this.activeUsers.add(selectedUser.email);
	        this.userLocaks[selectedUser.email] = Date.now();
	        return {
	            user: selectedUser,
	            selectionTime: Date.now() - startTime
	        };
	    }
	    releaseUser(email){
	        if (this.activeUsers.has(email) {
	            this.activeUsers.delete(email);
	            delete this.userLocks[emial];
	        }
	        return false;
	     }
	}
This class ensures that:
- Each virtual user gets a unique, authenticated user token
- Users are efficiently allocated and released
- Test execution doesn’t exhaust available user credentials
Test Scenarios
We’ve implemented three primary test scenarios, each focusing on different aspects of the system.
Session Management
These tests focus on session management, including creation, retrieval, and deletion. For example:
	group("1. Create Chat Session", function() {
	    const startTime = Date.now();
	    const chat1Payload = {
	        .....
	    };
	    let response = http.post(
	        `${BASE_URL}/sessions`,
	        JSON.stringify(chat1Payload),
	        { headers: bffHeaders }
	    };
	    check(response, {
	        'chat session created': (r) => r.status === 201,
	    }) || failureRate.add(1);
	    sessionCreationTime.add(Date.now() - startTime);
	    activeSessionsCount.add(1);
	    sleep(THINK_TIME);
Bot-Specific Tests
These tests focus on the bot’s response time and accuracy and have different flavors to explore how the system behaves in response to file uploads. For example:
	group('1. Bot Response', function() {
	    const startTime = Date.now();
	    const response = http.get(`${BASE_URL}/botresponse?query=What+is+AI&userId=${user.id}&botId=${BOT_ID}&sessionId=${sessionId}`, { headers: botHeaders } );
	    check(response, {'response received': (r) => r.status === 200, }) || failureRate.add(1);
	    botResponseTime.add(Date.now() - startTime);
	    sleep(THINK_TIME);
	}
Combined End-to-End Tests
These tests simulate complete user journeys across both services, for example:
	group("2. Create first session and get bot response", function () {
	    const startTime = Date.now();
	    let response = http.post(`${BASE_URL}/sessions`, JSON.stringify(chat1Payload), { headers: bffHeaders });
	    const msgStartTime = Date.now();
	    response = http.get(`${BASE_URL}/botresponse?query=Session+1%2C+Hi&userId=${user.id}&botId=${botId}&sessionId=${session1Id}`, { headers: botHeaders });
	    check(response, {"bot response confirmed": (r) => r.status === 200, }) || failureRate.add(1);
	    messageResponseTime.add(Date.now() - msgStartTime);
	    firstConversationTime.add(Date.now() - startTime);
	});
Load Profiles
For each test scenario, we defined specific load profiles and performance thresholds. For example, for the combined test:
	export const options = {
	    scenarios: {
	        ramp_up_users: {
	            executor: "ramping-vus",
	            startVUs: 1,
	            stages: [
	                // * 5 for numbers belows as the test was executed over 5 machines
	                // Initial ramp-up
	                { duration: '3m', target: 5 },    // Ramp up to 25 users over 3 minutes
	                { duration: '15m', target: 5 },    // Hold at 25 users for 5 minutes
	                // Second ramp-up
	                { duration: '3m', target: 10 },    // Ramp up to 50 users over 3
	                { duration: '15m', target: 10 },    // Hold at 50 users for 5 minutes
	                // Final ramp-up and plateau
	                { duration: '3m', target: 20 },   // Ramp up to 100 users over 5 minutes
	                { duration: '15m', target: 20 },  // Hold at 100 users for 10 minutes
	                // Ramp-down
	                { duration: '10m', target: 0 }      // Graceful ramp down
	            ],
	            gracefulRampDown: '10m'
	        },
	    },
	    thresholds: {
	        total_session_time: ["p(95)<1500000"],
	        bot_setup_time: ["p(95)<10000"],
	        sessions_fetch_time: ["p(95)<8000"],
	        first_conversation_time: ["p(95)<10000"],
	        session_management_time: ["p(95)<1500000"],
	        message_response_time: ["p(95)<8000"],
	        failed_requests: ["rate<0.1"],
	    },
	};
Understanding Load Test Reports
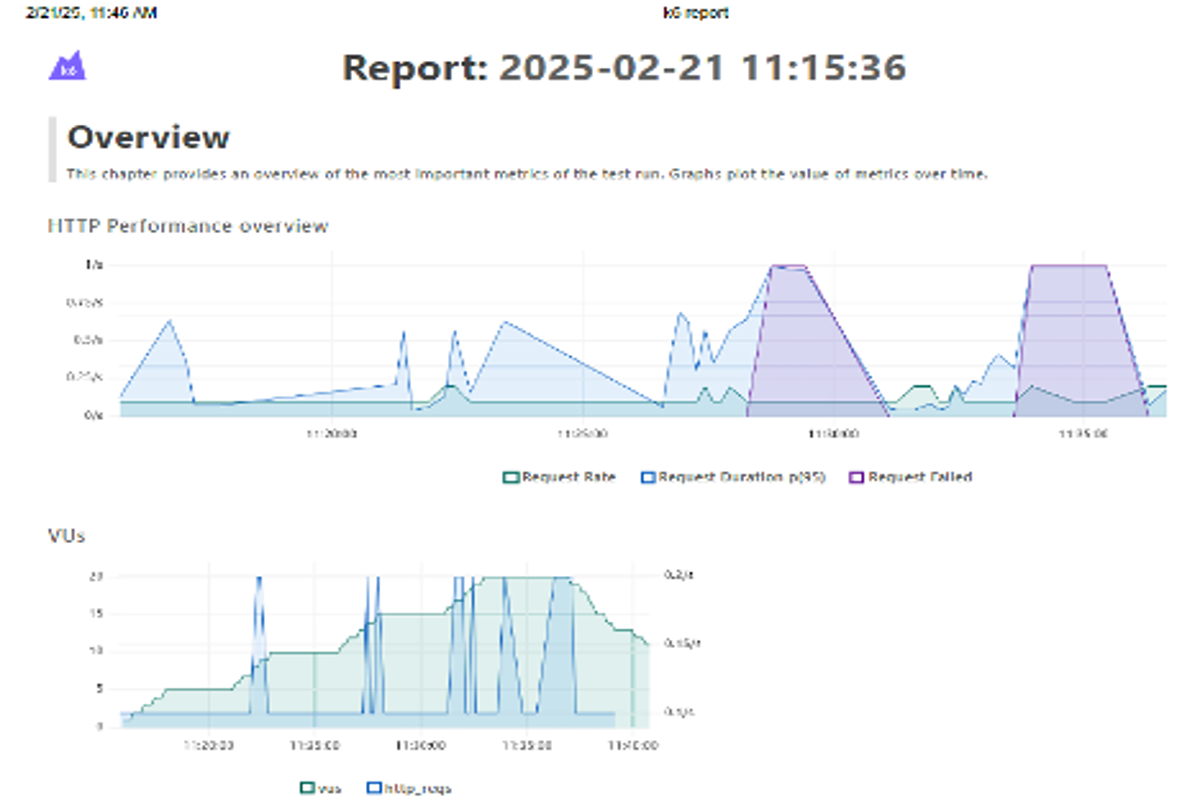
An essential part of our load-testing framework is the ability to generate comprehensive reports that provide visibility into system performance. Let’s look at what these reports typically show and how they inform our understanding of the system.

Sample from the test report
What Test Reports Reveal
Our test reports provide several categories of metrics that tell a story about how our system performs under load:
- HTTP Performance Overview: These charts show the request rate, duration percentiles, and failure rates over time. The fluctuations in these graphs help us visualize how the system responds as virtual users (VUs) increase and decrease.
- Virtual User Metrics: These charts display the number of active VUs alongside the HTTP request count, showing the relationship between user load and system activity.
- Response Time Distributions: These metrics break down request durations into percentiles (p90, p95, p99), helping us understand not just average performance but also the experience of users who encounter slower responses.
- Request Lifecycle Breakdown: The reports provide detailed timing for different phases of requests — connecting, TLS handshaking, sending, waiting, and receiving — revealing where time is spent during interactions.
Sample Observations from Recent Tests
In our recent load tests, the reports highlighted several interesting patterns:
- Metadata Layer Report: The report showed response times generally under 20 seconds on average, with p95 values reaching up to 59 seconds during peak load. Request rates remained relatively stable, even as virtual user counts increased to 20 users.
- Bot Service Report: These reports typically show higher data transfer volumes compared to metadata layer tests, reflecting the larger response payloads from AI-generated content. The receiving time metrics are notably higher, indicating the time spent processing these larger responses.
- Load Ramp-Up Effects: Both services show interesting patterns during the ramp-up phases of tests, with performance metrics often stabilizing after initial spikes.
- Connection Handling: The reports reveal differences in how connection phases (TLS handshaking, connecting) behave under increasing load, providing insights into network-level performance.
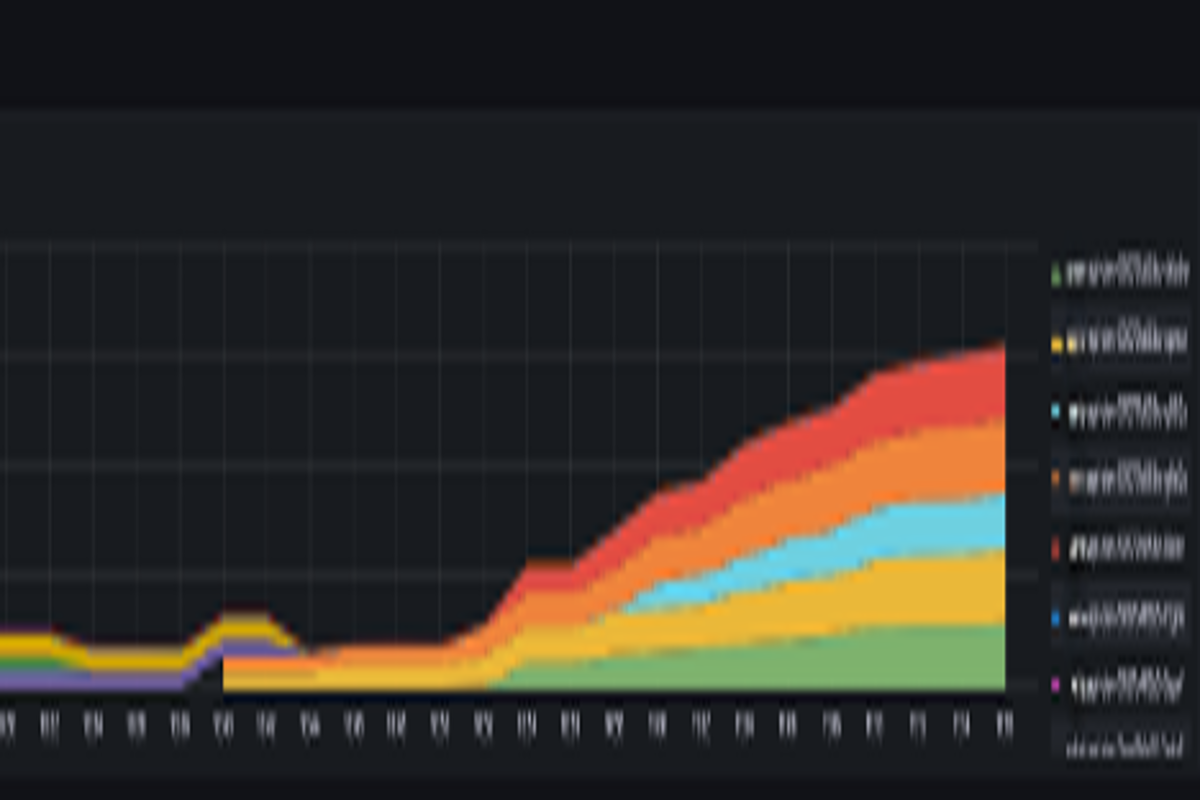
These visual and statistical representations help us monitor the system’s performance over time. Monitoring Grafana dashboards during the test run guides our focus toward areas that would benefit from optimization. For example, we’ve identified a memory leak in the metadata layer. As the load starts, memory usage goes up but stays the same after it ends:

Memory Leak
Conclusion
Building a comprehensive load-testing framework for our AI-powered chatbot has provided valuable insights into our application’s performance characteristics. By separating concerns, implementing proper user management, and creating detailed reports, we’ve established a robust foundation for ensuring our chatbot performs reliably at scale. The ability to visualize performance patterns through detailed reports allows us to make informed decisions about system optimizations and capacity planning. As we continue to enhance our chatbot’s capabilities, our load-testing framework evolves alongside it, helping us maintain high performance and reliability for our enterprise users.
This article uses real-world experience implementing load testing for an enterprise AI chatbot application. The code samples and test results have been adapted and simplified for clarity while preserving the core architecture, methodologies, and insights.

